Baseline
How does my energy consumption look like and how does it compare to others?
Baseline
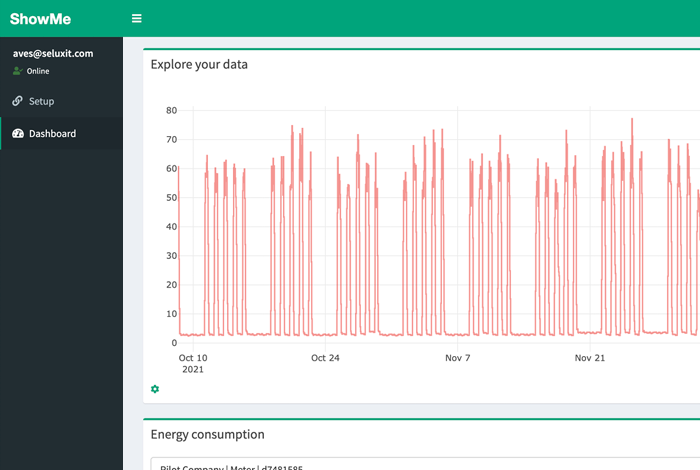
Most energy consumers have a typical weekly consumption pattern. During working hours, the consumption is high, and it should be lower during closing hours.
The energy consumption at times when a building is empty, is also called the idle consumption.
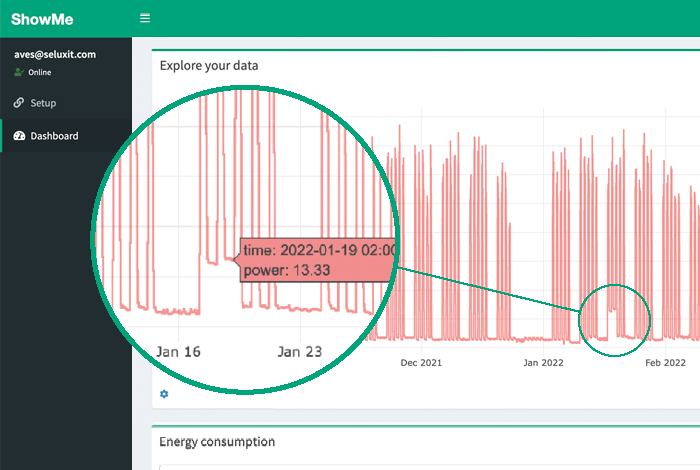
Baseline Irregularity
Even though we have procedures in place to minimize energy waste, sometimes things go wrong.
Such events can be seen as a disturbance in the otherwise repetitive pattern of the Baseline.
Irregularity Cost
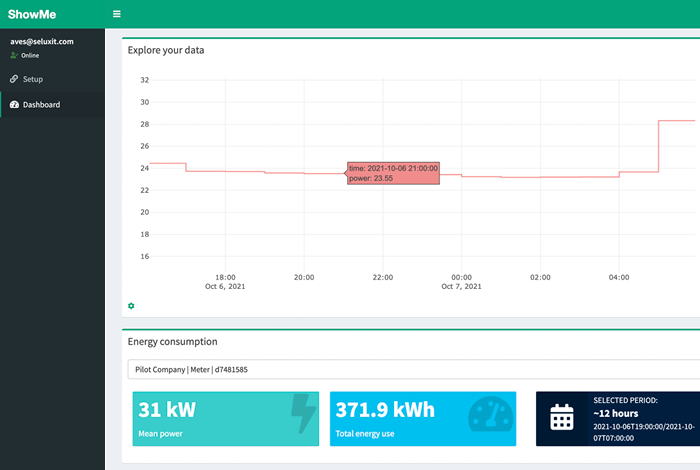
By zooming in on the timeframe when the Irregularity happened, our system can calculate the cost of the event.
In this example 371.9 kWh were used, and this is probably not the only occurrence. By multiplying this number with the average price per kWh and the expected number of times such an event happens per year, you get a good indication of how much you can invest to avoid such events in the future.
When am I using my energy?
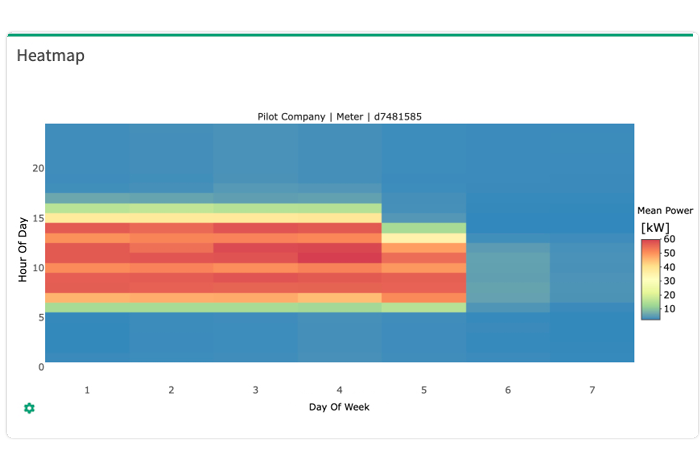
Seluxit EMS will also generate a “Heatmap” over your energy consumption. In the heatmap you can clearly see at what times you use most energy. The energy usage should coincide with the times when the company is producing goods or when people are in the office.
Idle Consumption Cost
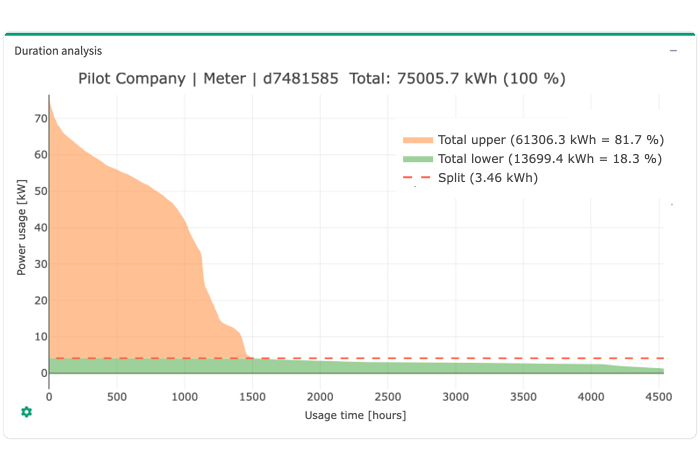
For the advanced user, we generate a duration curve that clearly can show the idle consumption.
The idle consumption is used 24 hours a day, 365 days a year. Therefore even small consumptions can add up to substantial amounts of energy over the course of a year.
Reducing the idle consumption therefore represents a good opportunity to save and avoid waste of energy.
What is my saving potential?
With Seluxit EMS you can find your idle consumption as well as the cost for irregularities.
Irregularities can usually be eliminated and idle consumption can typically be lowered by up 50%.

